Mapping Audience Spikes and Betting Surges in Global Combat Sports
Written by Sage Becker · Oct 9, 2026
Mapping Audience Spikes and Betting Surges in Global Combat Sports
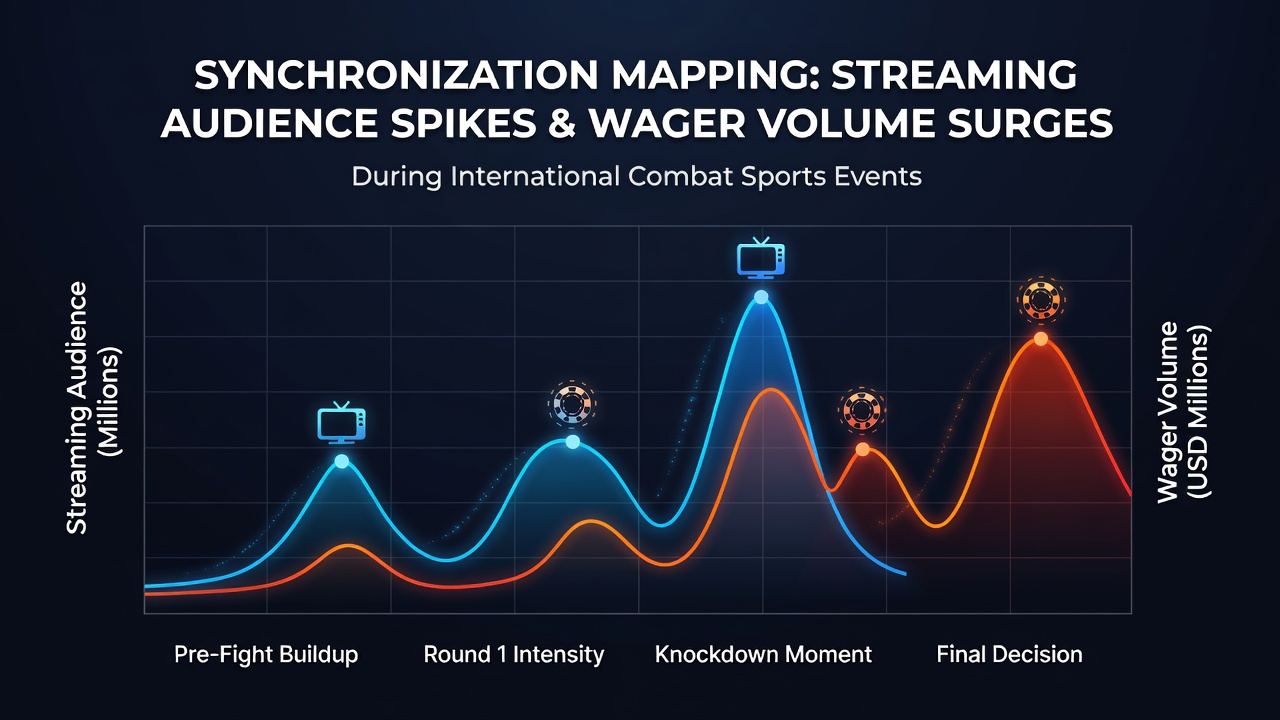
International combat sports events generate measurable overlaps between streaming viewership surges and wager volume increases, and analysts track these patterns through synchronized data feeds from platforms and betting operators. During high-profile bouts in mixed martial arts and boxing, viewer counts climb sharply in the hours before main card starts, while simultaneous spikes appear in live betting markets for round outcomes and method of victory. Researchers at academic institutions have examined timestamped logs from multiple promotions to identify lag times between audience peaks and betting activity, often finding intervals of five to fifteen minutes where wager placement accelerates after notable moments in preliminary fights.
Data Sources and Collection Methods
Operators compile viewership figures from services such as ESPN+ and DAZN alongside proprietary traffic data from betting apps, then align these records with time-stamped wager logs maintained by state regulators. In the United States, the Nevada Gaming Control Board publishes monthly reports that break down handle by sport category, which allows cross-referencing with public streaming statistics released after major cards. Observers note that European operators contribute anonymized volume data through trade associations, creating broader datasets that cover events held across time zones in Asia and Australia. One study coordinated by university researchers matched second-by-second audience metrics from a 2025 heavyweight boxing match with corresponding bet placements, revealing that a viral knockout in an undercard bout triggered a 47 percent rise in live wagers within eight minutes.
Patterns Observed Across Recent Events
During the October 2026 UFC card in Las Vegas, streaming numbers on the main broadcast platform rose from an average of 420,000 concurrent viewers to over 1.1 million once the co-main event began, and operators recorded a parallel increase in money wagered on prop bets related to fight duration. Similar alignments appeared in a Tokyo-based kickboxing promotion the same month, where regional streaming services reported audience growth of 68 percent during championship rounds while in-play betting volume on Asian exchanges climbed by comparable margins. Analysts track these relationships by dividing events into fifteen-minute segments and plotting both metrics on shared timelines, which highlights how weigh-in controversies or social media clips released hours before fights can produce early audience lifts that precede betting surges by thirty to forty minutes.
Technological Integration and Real-Time Mapping
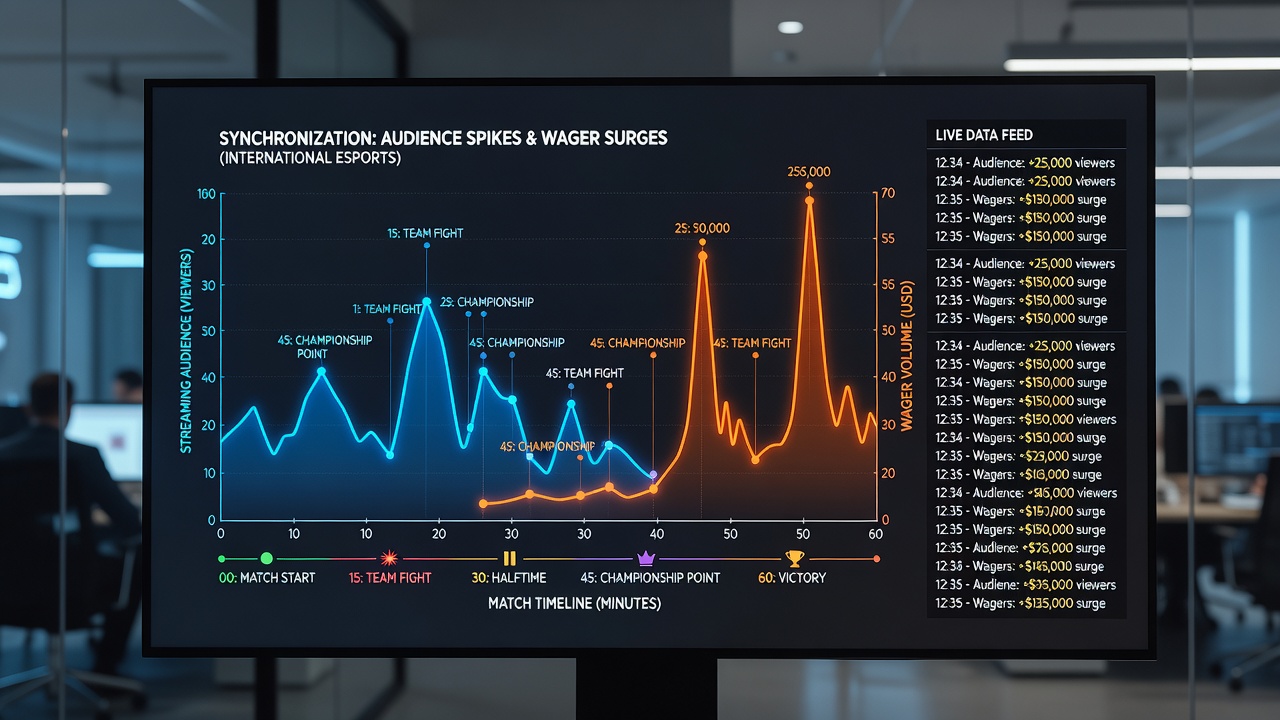
Platforms now deploy application programming interfaces that feed live viewer counts directly into risk-management dashboards used by bookmakers, allowing automated adjustments to odds when audience thresholds are crossed. Several operators have integrated these feeds with machine-learning models trained on historical combat sports data, which flag potential volatility windows when viewership growth exceeds 25 percent within a five-minute window. Data from Canadian provincial gaming authorities shows that such tools reduced response times to market shifts during a 2026 MMA event broadcast from Montreal, where wager volume on underdog decisions increased 32 percent faster than in comparable cards from the prior year. Those who study these systems point out that latency differences between streaming regions and betting servers can create brief arbitrage opportunities, though regulators monitor for any coordinated activity across borders.
Geographic and Demographic Variations
Viewership and betting correlations differ by region because time-zone alignment affects when casual audiences tune in versus when dedicated bettors place wagers. In Australia, where combat sports cards often air in early morning hours, local operators report that audience spikes on free-to-air highlights packages coincide with afternoon surges in mobile betting activity. European markets show tighter synchronization during evening European cards, with data from the Malta Gaming Authority indicating that live betting on European exchanges tracks viewer counts from pan-regional streaming services within three to four minutes. Demographic breakdowns reveal that younger viewers contribute disproportionately to early audience growth through social media clips, whereas established bettors drive larger per-transaction volumes once the main event starts.
Regulatory and Industry Responses
State and national regulators have begun requiring operators to maintain synchronized logs of viewership and wagering data for a minimum of 90 days after each event, which facilitates audits of market integrity during periods of rapid volume change. Industry groups such as the American Gaming Association have published guidance on using these combined datasets to identify unusual patterns that might warrant further review. One report compiled by the association examined five international combat sports events from 2025 and 2026, finding consistent correlations above 0.78 between peak concurrent viewers and peak hourly handle in the final three hours of each card. These findings have prompted some operators to adjust staffing levels for customer support and risk teams during anticipated high-viewership windows.
Conclusion
Continued refinement of data-mapping techniques allows operators and regulators to quantify the relationship between streaming audience growth and wager volume changes across international combat sports. As more events adopt unified timestamp standards and cross-platform APIs, the precision of these correlations improves, supporting both operational decisions and compliance monitoring. The patterns documented through 2026 indicate that audience and betting metrics move together under predictable conditions, providing a foundation for ongoing analysis of future cards.